Today’s topics including:
- Adding Index Column is very convenient to do complex calculation
- How to use EARLIER to get previous row’s value (like LEAD/LAG in SQL)
- How to use PRODUCTX to iterate multiplication
- How to use Measure/Calculated Column to do above calculation
Scenario:
Bank Super-E has two key investment products: Good Money and Best Choice, and would like to check the performance of them. The indicators includes Monthly Return and Cumulative Return.
The formula are:
Monthly Return = Monthly Return(n)/Monthly Return(n-1) - 1
Cumulative Return = PRODUCT[1 + Monthly Return(1…n)] - 1
Sample Data and Preparation:
I create a spreadsheet with three columns, the value column is generated by RAND() in Excel, so apparently the performance of these two products of bank Super-E is very unstable :)

Load data to Power BI and add Index Column in Query Editor, I will let you know why we should take this action in the later calculation. Before indexing, another important step is Sort. Because the calculation is per Product, so I need to sort Column [Product] first ,then sort Column [Date].You could see the sorting sequence in the column name.

Add Index Column, it doesn’t matter about starting from 0 or 1.

Close and Apply, the preparation work is done.
Calculate Monthly Return:
As we know, the formula is Monthly Return(n)/Monthly Return(n-1) - 1, so I need previous month value to do this calculation. In SQL, we could easily use LAG function
LAG([Value],1) OVER (PARTITION BY [Product] ORDER BY [Date] DESC)
How can we do this calculation in Power BI?
One key DAX function is EARLIER
Returns the current value of the specified column in an outer evaluation pass of the mentioned column.
EARLIER is useful for nested calculations where you want to use a certain value as an input and produce calculations based on that input. In Microsoft Excel, you can do such calculations only within the context of the current row; however, in DAX you can store the value of the input and then make calculation using data from the entire table.
EARLIER is mostly used in the context of calculated columns.
So I create a calculated column based on below expression
PreValue = CALCULATE(MAX(Data[Value]),
                 ALL(Data),
                 Data[Product] = EARLIER(Data[Product]),
                 Data[Index] = EARLIER(Data[Index])+1
                 )
Data[Product] = EARLIER(Data[Product]), limit the calcualtion in same product group.
Data[Index] = EARLIER(Data[Index])+1, this is why I created index at first beginning.I invite Index as a input value and plus 1, which equals to the filtered row’s value, and there will be only one row meeting this filter condition. e.g. 1 = 0 + 1; 15 = 14 +1
MAX(Data[Value]), I just need a calculation function to get the value, as above explanation that only one is filtered, it could be SUM, MIN, etc.
Then I think you know how to calculate Monthly Return now, just add another calculated column based on formula
MonthlyReturn = IF(Data[PreValue] = BLANK(),
                   BLANK(),
                   (Data[Value]/Data[PreValue])-1)
I present the number in a simple Matrix with product as slicer. (Really unstable performance)

Calculate Cumulative Return:
The initial requirement I get from Bank Super-E is they could check N months Cumulative Return of any month they select. So, it must be a dynamic calculation, my solution is creating a measure to do this job.
Based on the formula, I need a function to do iteration of multiplication, and PRODUCTX could handle this type calculation. (Normally a DAX with X as Name End is iteration function, like SUM, SUMX)
Returns the product of an expression evaluated for each row in a table.
The DAX expression will be
Investment Rate = CALCULATE(PRODUCTX(Data,1+Data[MonthlyReturn])-1,
                    FILTER(ALLSELECTED(Data),
                           COUNTROWS(FILTER(Data,
                                            Data[Product] = EARLIER(Data[Product])
                                            && Data[Index] >= EARLIER(Data[Index])))))
You will notice that I filter the data twice, because I am not able to directly use EARLIER function in CALCULATE function in a measure, and this is a trick to pass the nested logic from a table filter to a measure calculation.
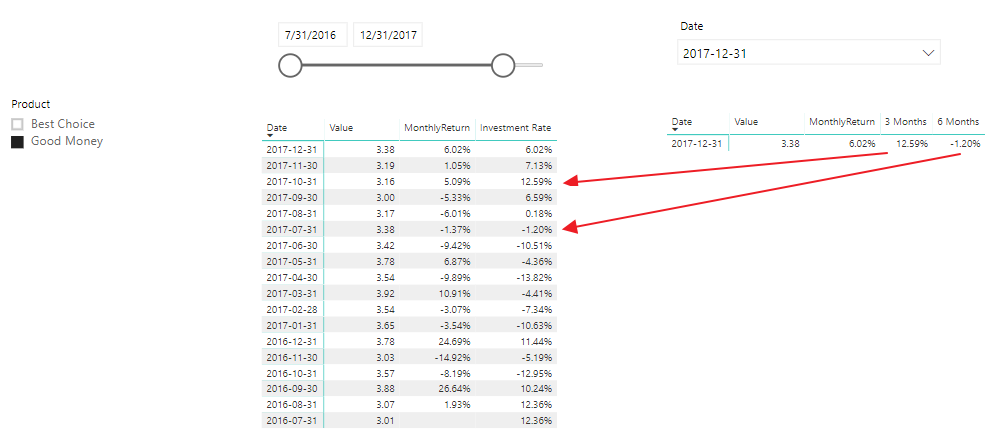
I add a slide date slicer to the report as below, through moving the right bar, Bank Super-E could select one month to check cumulative return by counting down N months. The calculation is pure dynamic which meets my expectation.

But I get further requirement from Bank Super-E, they feel inconvenient to count and move the date bar. After negotiation, they would like to check fixed months cumulative return, like 3 months, 6 months, 1 year, etc. and the final output is only show one month per selecting drop down date slicer.
In this case, I could create calculated column to get fixed value of each month, but the iteration is for certain rows instead of whole product group.
Example: iterate three rows to calculate the result for 3 months cumulative return.

How can we do this?
3 Months = CALCULATE(PRODUCTX(Data,1+Data[MonthlyReturn])-1,
                    FILTER(Data,
                           Data[Product] = EARLIER(Data[Product])
                           && Data[Index] >= EARLIER(Data[Index])
                           && Data[Index] <= EARLIER(Data[Index])+2))
I limit the iteration range based on Index Column, and get column and final output as below


Now, Bank Super-E is very happy with this report:) Hope you are happy with this content as well!
Thanks Eric Dong