
If you have a Power BI report growing bigger and bigger because of more requirements or you take over a complicated report from another developer, you might have the experience like below picture.

And I assume you may meet below problems
- Too many measures messed up with the fields in different tables, hard to locate?
- Complicated model with many tables, difficult to check the relationships?
- What are the sources and types of all these queries?
- ……
I am going to introduce some methods in this blog to keep Power BI report neat which will definitely improve the work efficiency and collaboration in the team. The topics include:
- How to organize measures
- How to make the layout more structured
- How to manage connections of data sources
- How to manage queries
- How to manage model and relationships
Let’s rock!
How to organize measures
If you ever created a report with more than 10 tables and 50 measures, you will know organizing measures well saves tons of time.
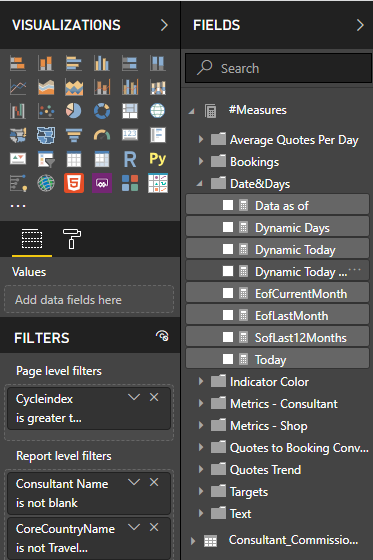
My solution is keeping all the measures in one place and categorize them in different folders, then it’s much easier to find and use them in any visuals. (Like below screenshot)
The step is quite simple:
Step One - create a table by using “Enter Data” under home tab, give the table name as “#Measures”. The # makes Measures table always display on the top of the Fields.
Step Two - create measures under this table then delete that default created column, now you have a place for measures only.
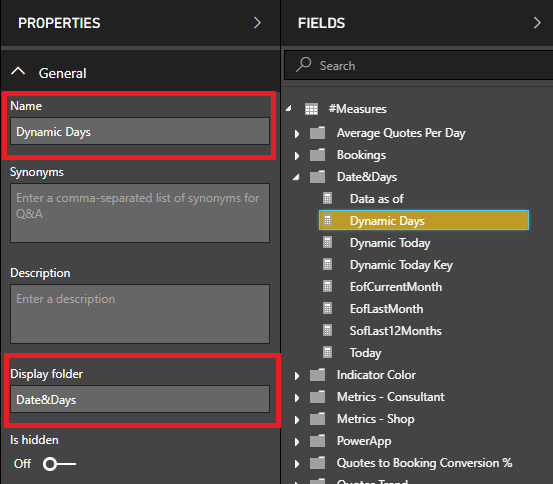
Step Three - go to “Model”, select/Multi-select measures, set up “Display Folder”.Once you have a folder created, you can move measures into the folder by dragging. You can also describe certain measures here if they are complicated which needs explanation. (You can use this method to organize the fields in other normal tables as well)
If you’d like to “clean” a report that you have already created with measures in different tables, you can move measures by using “Home Table” option under “Modeling” tab.

How to make the layout more structured
People have different ways to design the “front end”, so I won’t comment too much here.
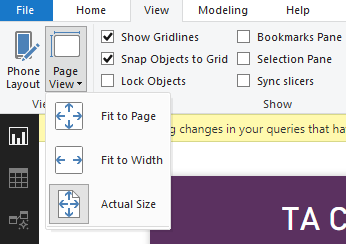
What I recommended is ticking “Show Gridlines” and “Snap Objects to Grid” under “View” tab, use “Actual Size” in “Page View”, and don’t overlay two many tiles in one page but try to keep them separated.
How to manage connections of data sources
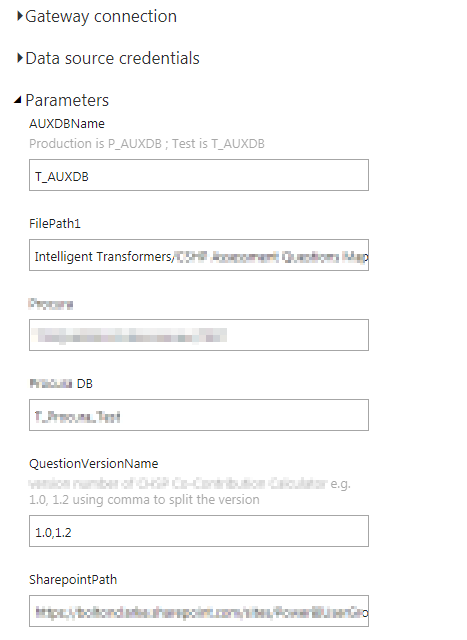
I have introduced this topic in my previous blog Best Practice and Advanced Usage of Parameters in Power BI.
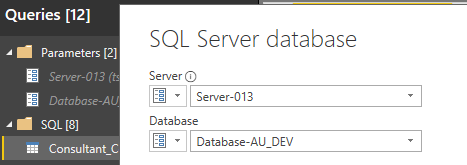
Manage all your connections in parameters, it’s easy for
- creating a new query by using the same data source
- switching data source from test to prod
- managing connections in Power BI services directly
How to manage queries
We can group our queries in Query Editor, the method is simply “New Group” and move queries into different Groups.
The Grouping method could be based on
- Type (function, parameter, query, etc.)
- Source Type (Excel, SQL Server, etc.)
- Database Name
- …
which depends on the data environment and the queries you are using, just make it clear and understandable.

How to manage model and relationships
Day after day, the data model could get much bigger with dozens of tables involved. It becomes increasingly difficult to understand and maintain the network of relationships in a single diagram.
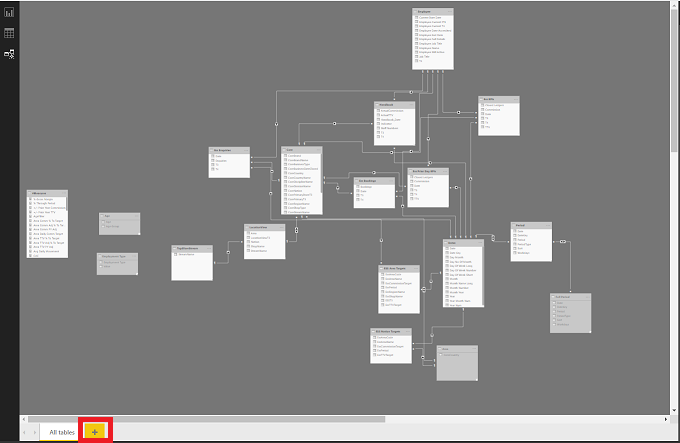
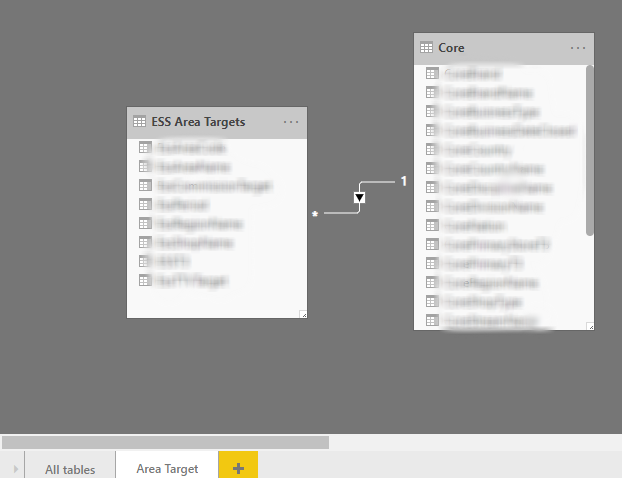
But we can create multiple layouts to show a subset of the model. Like the below example, I created a new layout with only two tables, the relationship in it is the same as the all tables view.
Please be noticed that though there is only one relationship between them, the other relationships with two tables are still there which are just not displayed. E.g. if you’d like to change this relationship to both direction filter, you will see a warning message because of the “filter loop”. You can treat this layout as a “Zoom out” for a couple of tables are relevant to a subject area.
Have fun!
![]()
Thanks
Eric Dong