
If we are preparing to visualize FYTD YoY Comparison, maybe the first thought is leveraging DATESYTD and line chart, and the measure will be
FYTD = CALCULATE([Measure],DATESYTD(Dim_Date[FullDateAlternateKey],"6-30"))
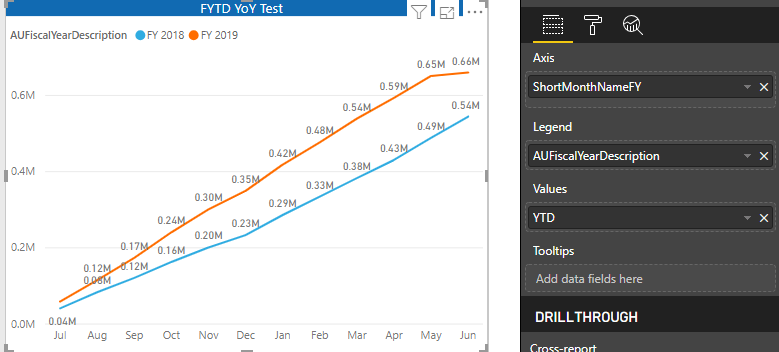
But if we want to present the variance, we need to calculate the difference and use another visual which takes further steps.
We do have a very cool custom visual called Power KPI can do a better job on this case.
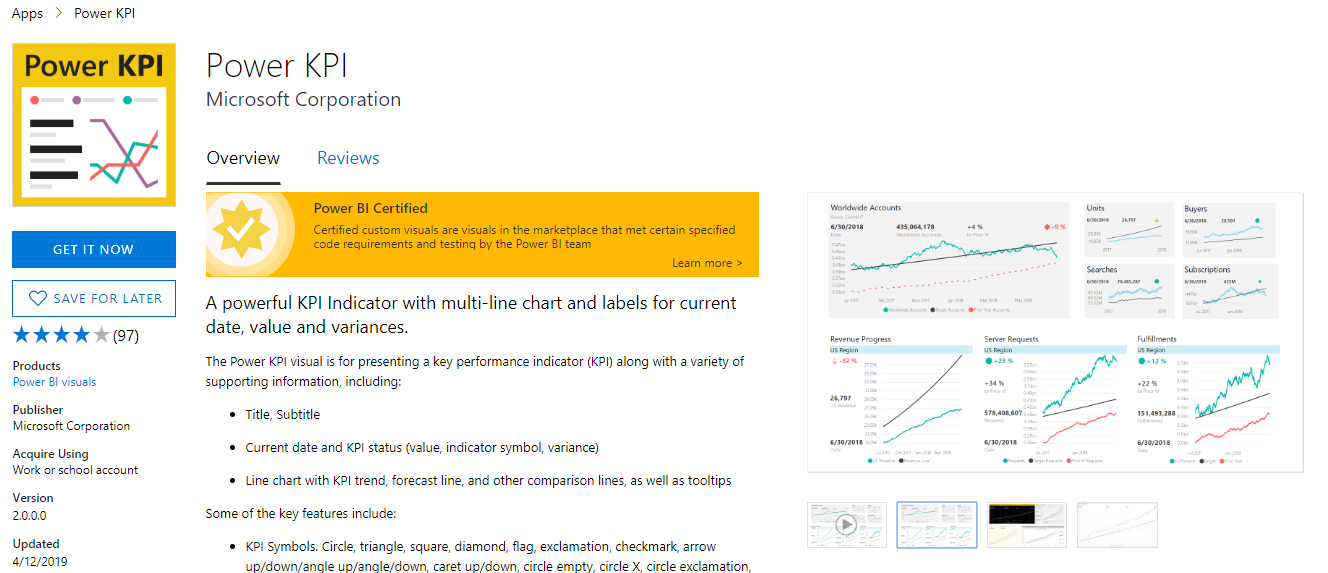
If we use Power KPI as the same way as we use line chart, we will get below result and we notice that the Actual Figure is default set as Last Year which is based on the series value alphabetically (2018 < 2019) and the variance is not we want as well.

I didn’t find a straightforward way to directly change the order about this comparison, so I created a new calculated column based on the financial year in Dim_Date table to make the series value as “Current Year” and “Previous Year”. The reason is “C” will be ordered ahead of “P”. The result tells me my assumption is correct.
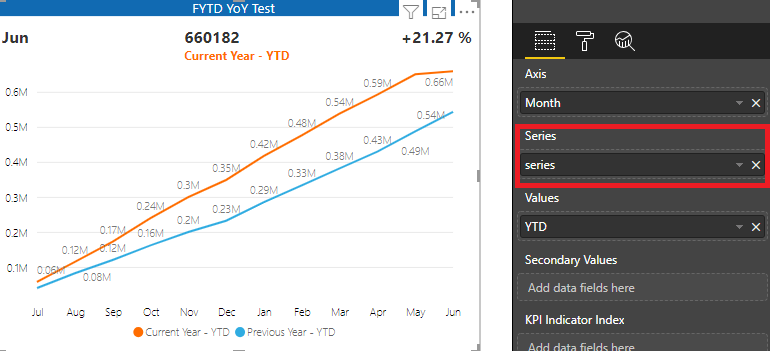
Hold on……seems there is something still wrong, current Year is indeed FYTD but the previous year is FYTM, because the calculation is DATESYTD(Dim_Date[FullDateAlternateKey],"6-30"). Can we change that “6-30” as dynamic month date? Unfortunately, based on my knowledge, we can’t. It seems that this formula only accepts a string like this but not a measure.

Okay, then what next? I decided to create two measures to present Current FYTD and Previous FYTD, and I can delete that static calculated column for new series which I don’t like.
In my Dim_Date table, I have a column called “CFTYIndicator” which shows Current FY as 1 and Previous FY as 0, so I thought I am gonna use below measure to achieve my goal.
LFYTD1 = CALCULATE([Measure],FILTER (
        ALLSELECTED (Dim_Date ),
        Dim_Date[FullDateAlternateKey] <= MAX ( Dim_Date[FullDateAlternateKey]) && Dim_Date[CFYIndicator]=0 )
    )
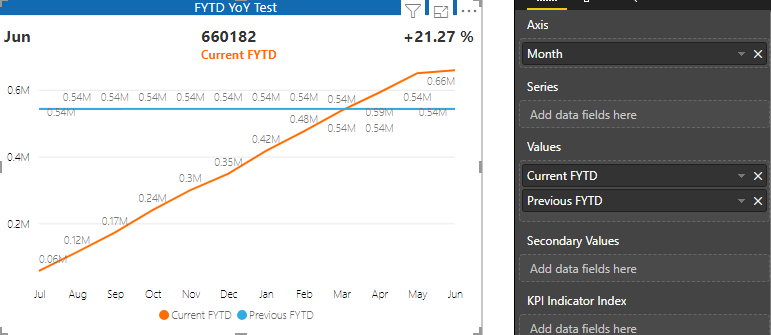
What??
This is totally not what I want.
Then I consider the logic again, Previous FYTD is exactly the same period of the current year, so I need to calculate the current year period first and then use “SAMEPERIODLASTYEAR” to do the job.
I re-write the measure as below
LFYTD2 =
var maxdate = CALCULATE([CutoffDate],ALL(Dim_Date))
return
CALCULATE([Measure],
SAMEPERIODLASTYEAR(FILTER (
         ALLSELECTED(Dim_Date[FullDateAlternateKey] ),
       Dim_Date[FullDateAlternateKey] <= MAX ( Dim_Date[FullDateAlternateKey]) && Dim_Date[FullDateAlternateKey]<maxdate)
    ))
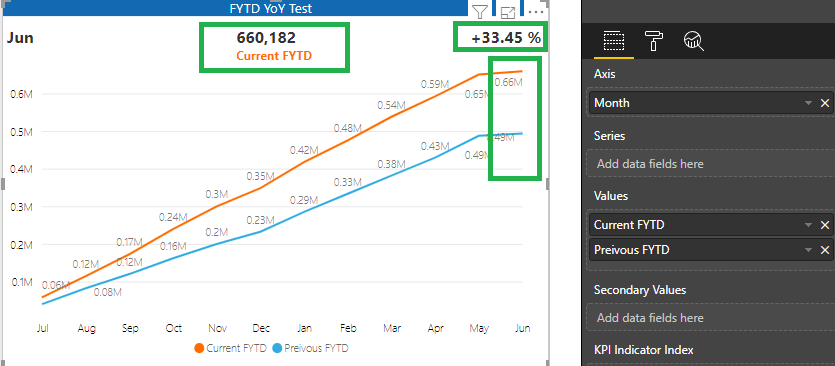
Finally, got it right. We present all the key info. in this one visual, and we could also leverage KPI indicator colour to do more stuff which I will not demonstrate in this blog.
The lesson here will be:
- Time Intelligence DAX is pretty powerful, try to think about it first when we write a measure
- Calculation and visualization could be a different concept, as in the Visual we have context
- Power KPI is a fantastic custom visual :)
Thanks
Eric Dong